The Mandelbrot Fractal
A facinating and beautiful formula

The Mandelbrot fractal is an extremely interesting little mathematical wonder. It's a simple formula, defined as:
fc(z)=z2+c
Where z starts at 0.
Okay, but what does this actually mean in simple words us humans can understand? A number is in the Mandelbrot set if f(0) does not escape to infinity, and if f(f(0)) doesn't, and if f(f(f(0))) doesn't, you get the point. The function can iterate infinite times and the number never escapes to infinity.
How does it not go to infinity though if you iterate infinite times? Well, think of a number like 2. 2 squared is 4. If I keep squaring it the number expands to infinity. Now what about 1? 1 squared is still 1. Okay now what about a number like 0.5 (1/2)? 0.5 squared is 0.25 (1/4). I can square this as many times as I want and it never reaches infinity.
As long as a number remains in the range of [-1,1], it will never reach infinity when squared indefinitely.
However with the '+ c' in the formula this changes things. Now the number escaping depends not only on z but c as well.
Okay, so c is a complex number (re + im). That's ANY number. And, z is part of the function's iteration. The function can be represented pretty simply in code. Here's some pseudocode to demonstrate:
def is_in_mandelbrot_set(c):
    z = 0
    for 0..infinity:
        z = pow(z, 2) + c

        if (z == infinity):
            return False
        else:
            return True
If you've noticed, the 'function' mentions a 'set'. This is what we know as the Mandelbrot fractal. The Mandelbrot set is a set of all complex numbers that don't escape to infinity when passed through this function infinite times.
Okay… so the Mandelbrot set is just a bunch of numbers that don't escape to infinity. But how do we get these incredible visualizations? Well, these renderings are based off of the real and complex portions of all the numbers in the set.
Generally, image renderings show the real part of the complex number on the x axis, and the imaginary part on the y axis. The complex numbers represented by re + im are now mapped to (x,y) coordinates via (re, im).
Then, we calculate if the number is part of the set and color it if it is.
But then if we just plot the image we get a really generic black and white photo… what gives?
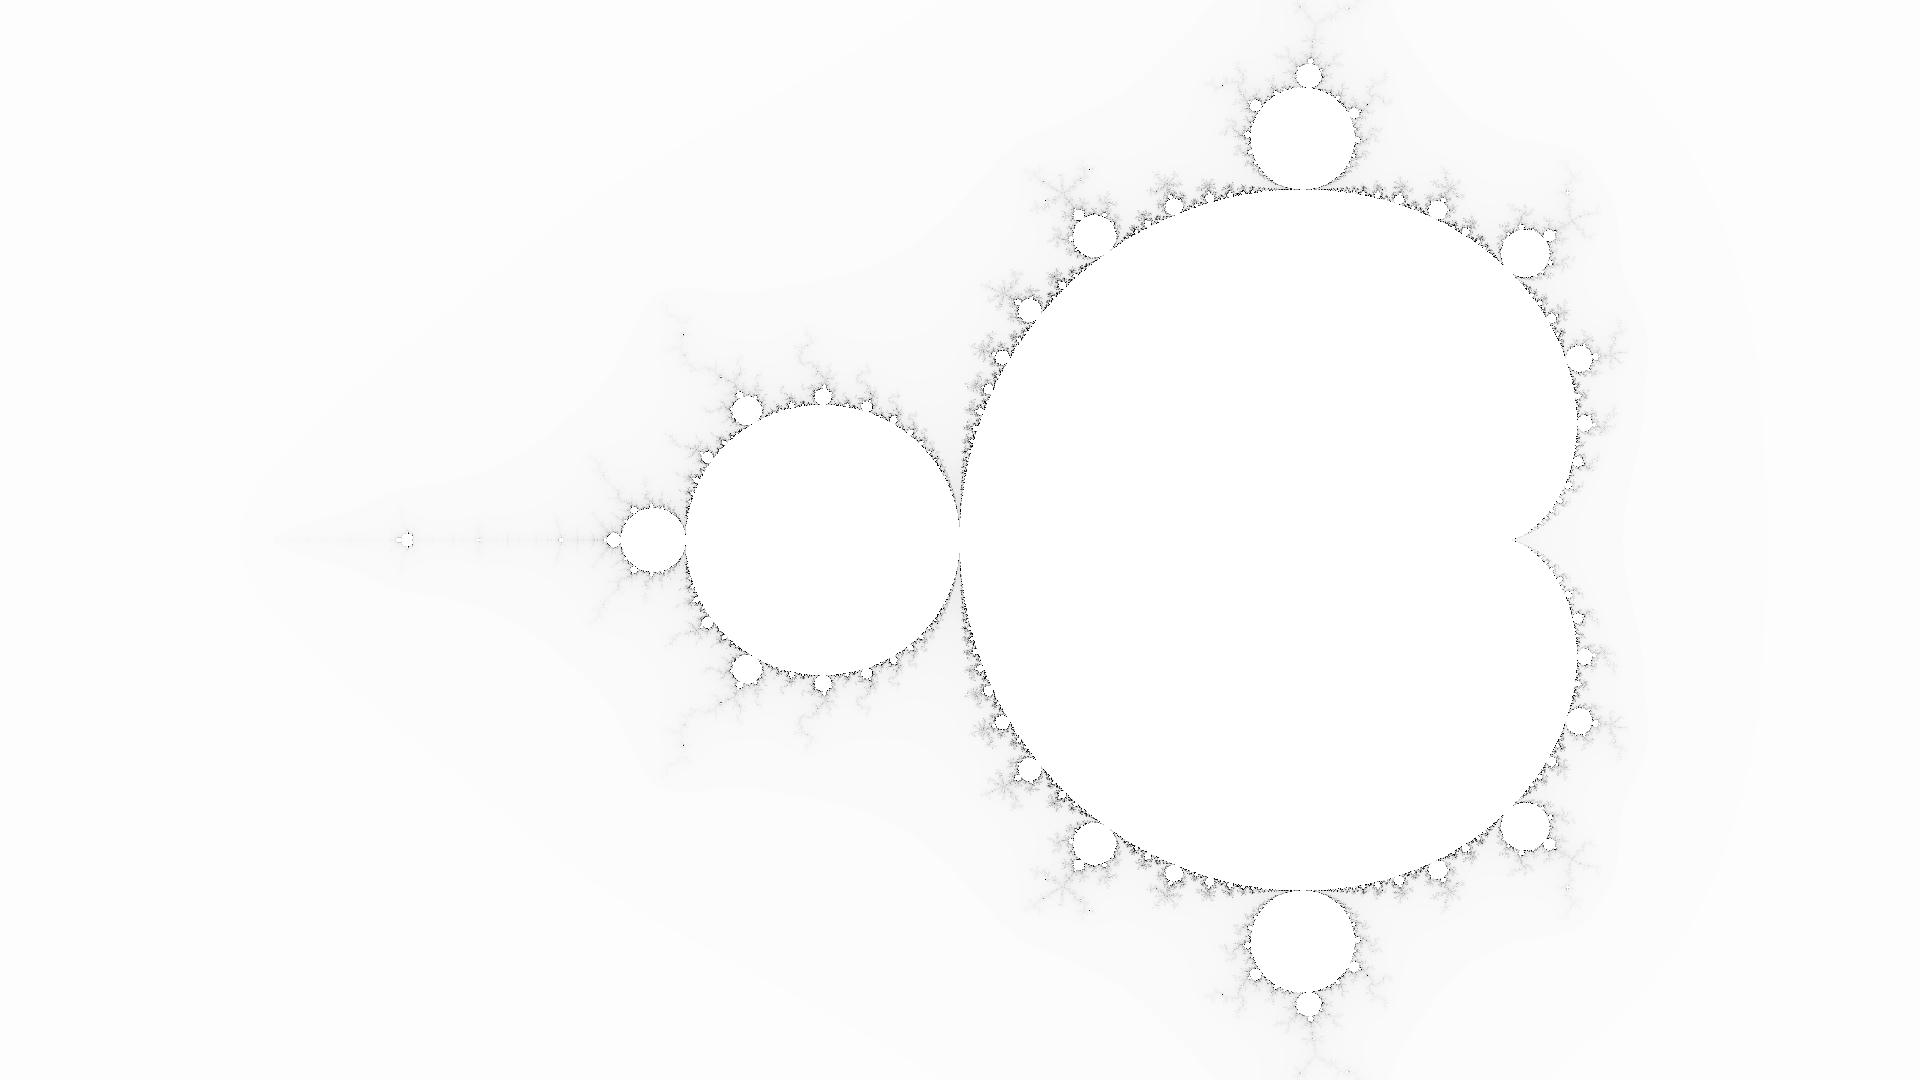
Well yeah, but this is all still theoretical. After all our function cannot possibly actually iterate to infinity.
In reality we escape the function after z escapes some arbitrary 'bailout' number we (the programmer/user) get to decide. Then we can use the number of iterations it took to sample colors from a color map.
This spices up rendering quite a bit, and makes it actually possible to render since we're not going all the way to infinity!
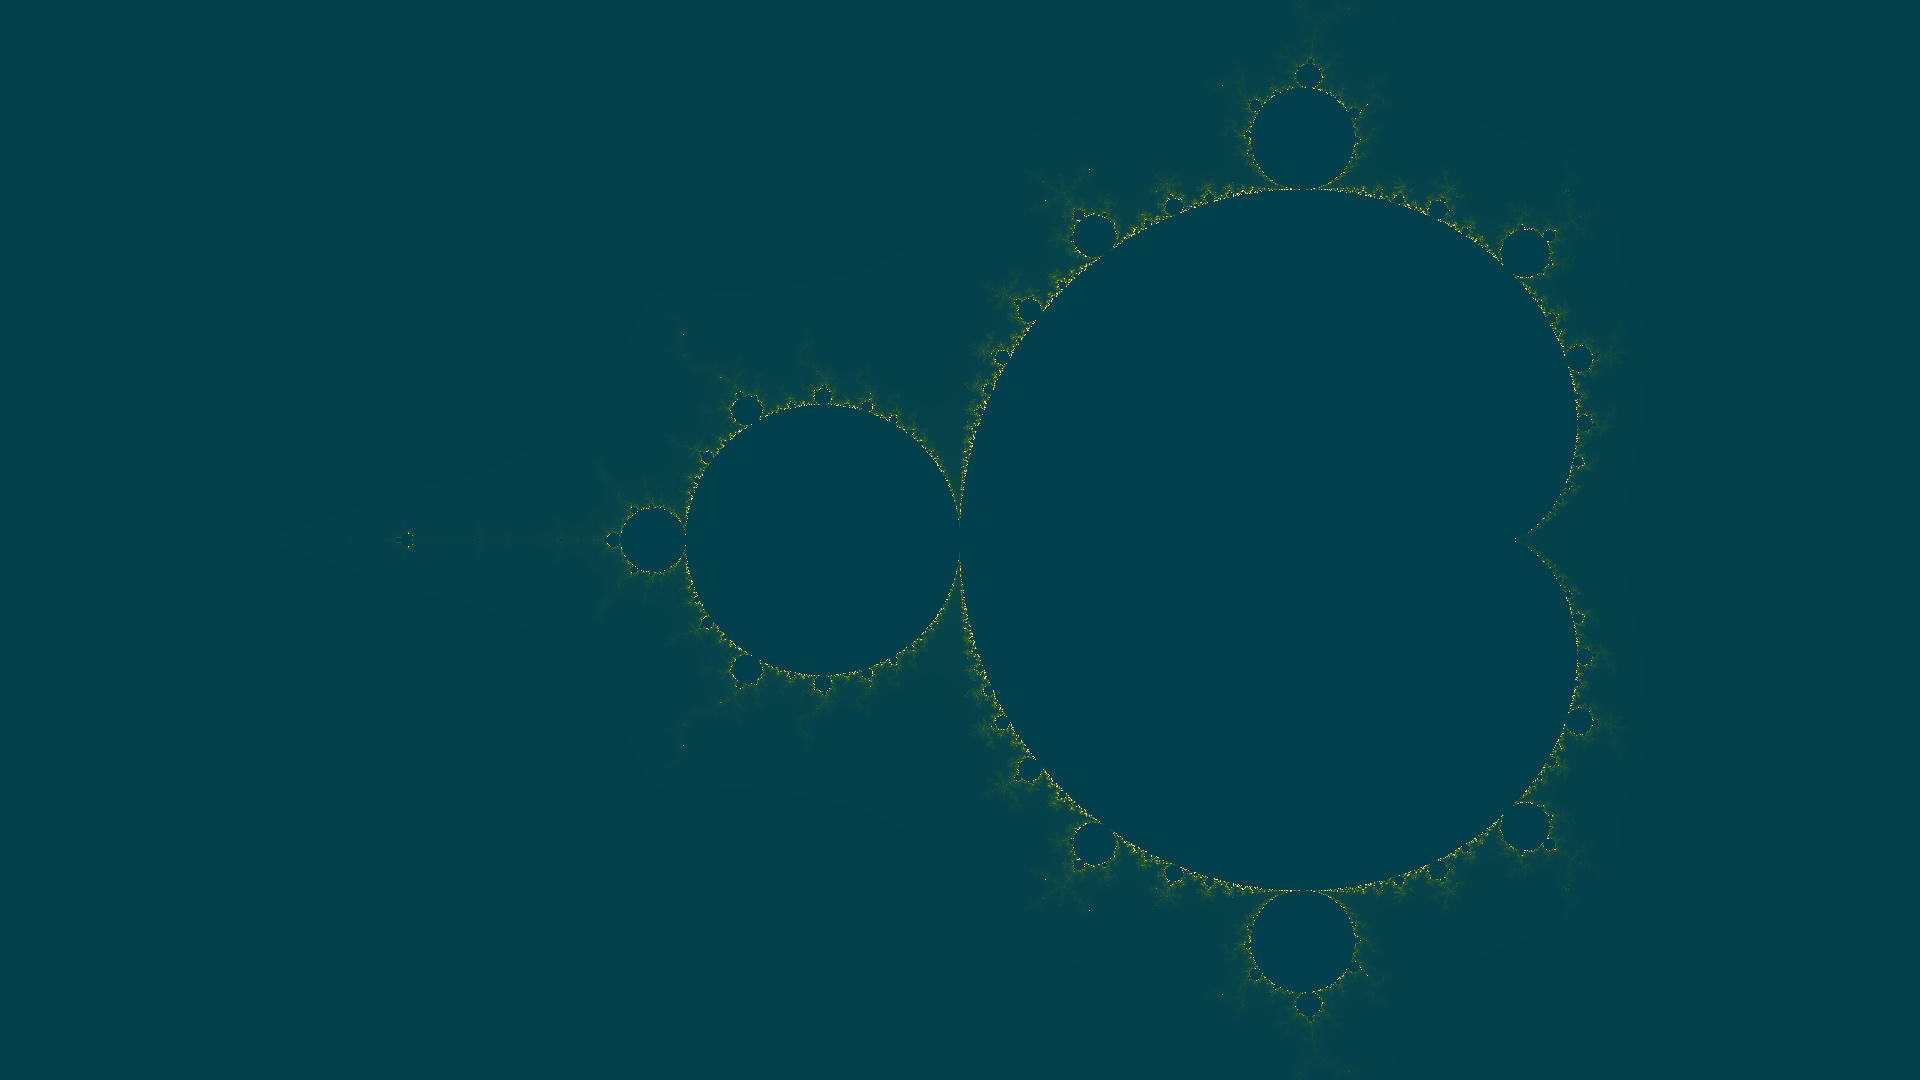
Great… now we have colorful renderings of the Mandelbrot fractal! It's worth noting that any value outside the range of Re [-2.5, 1] and Im [-1, 1] all escape to infinity, so for all the visualizations I've shown, the numbers all lie within this range.
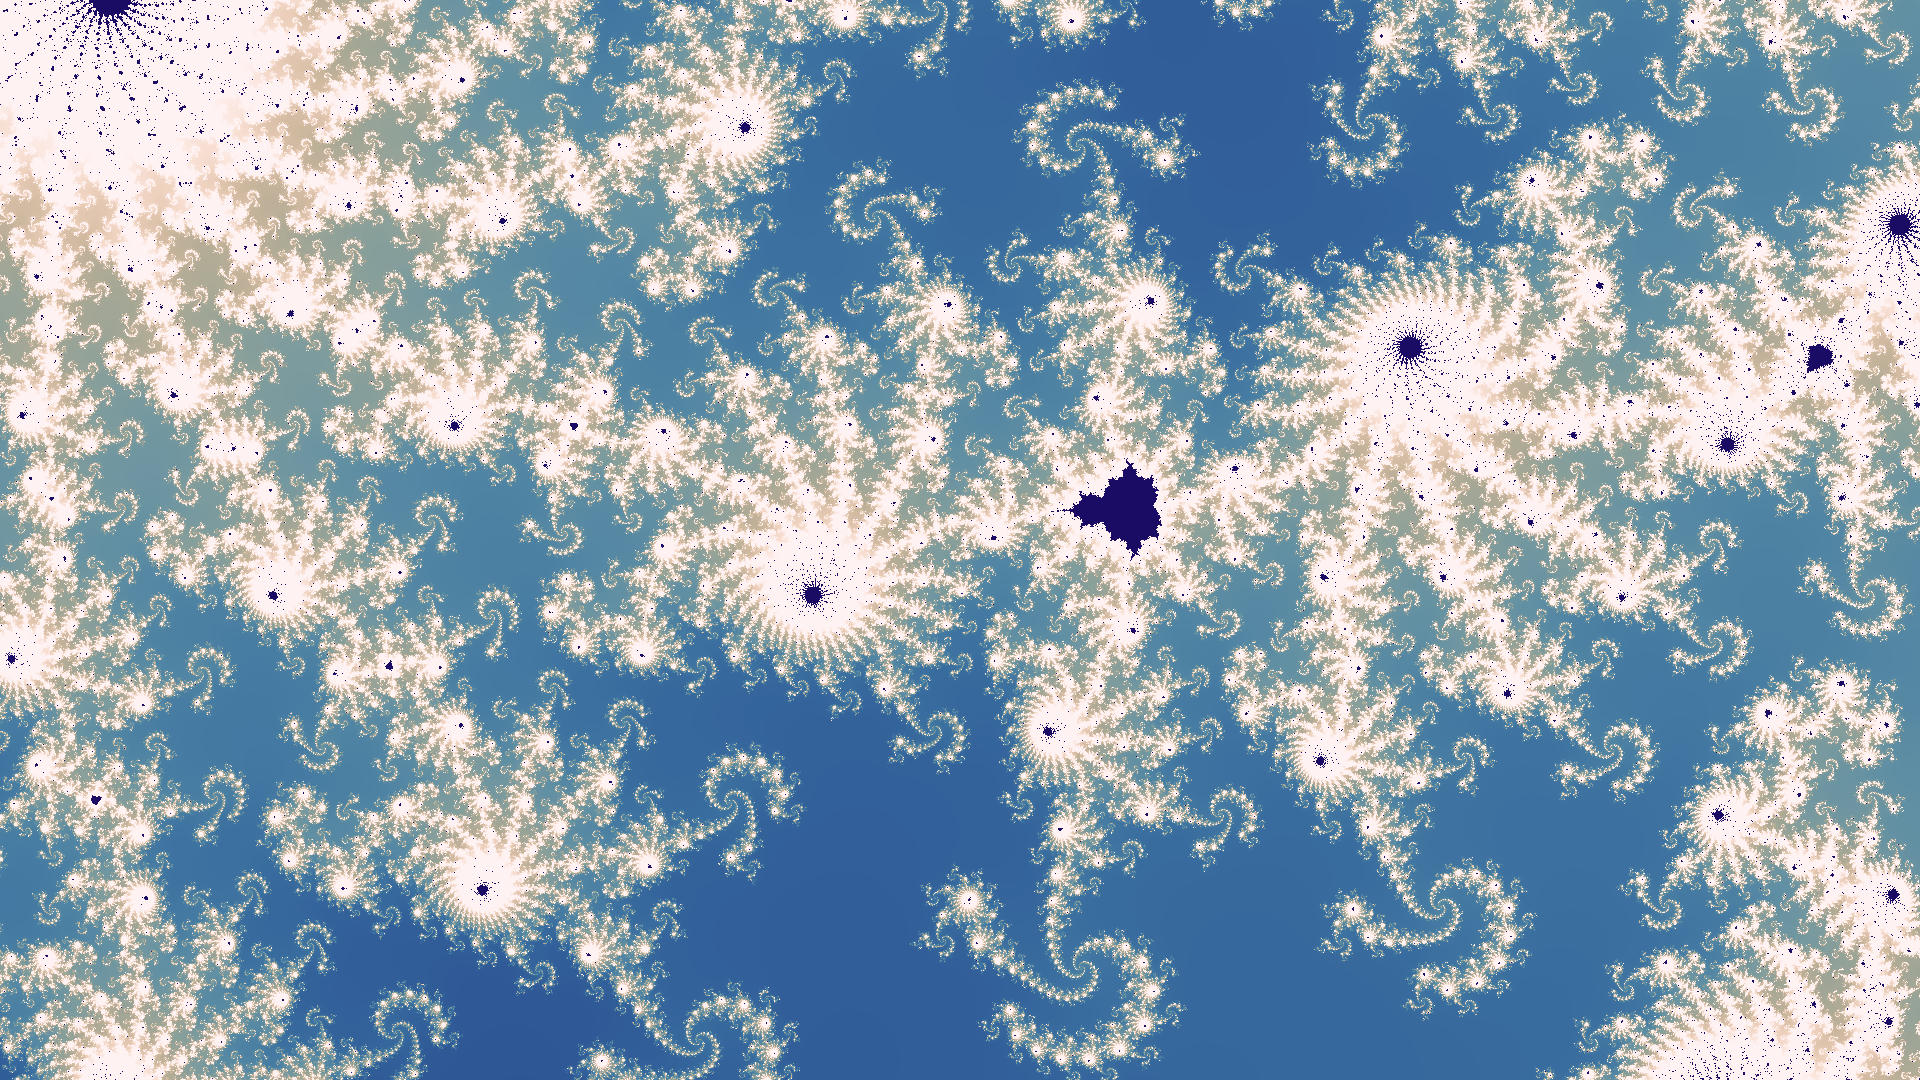
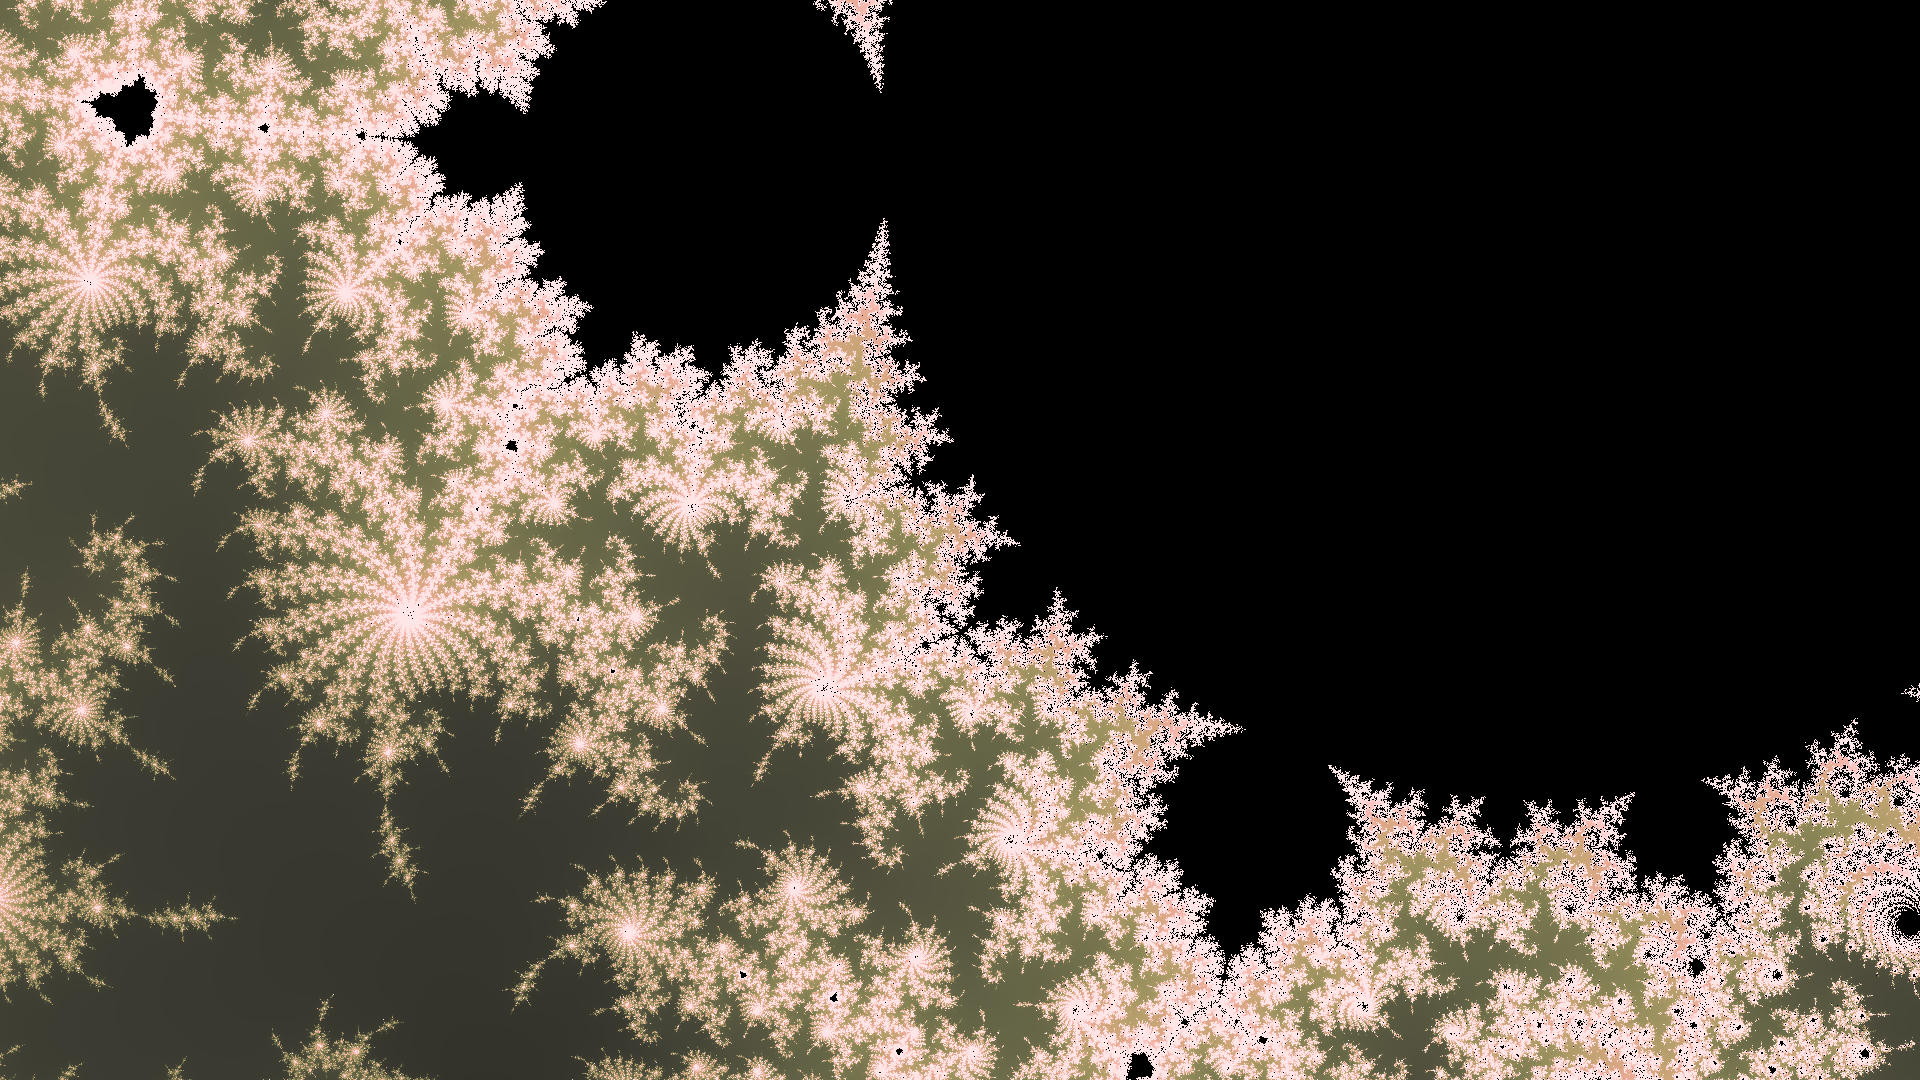
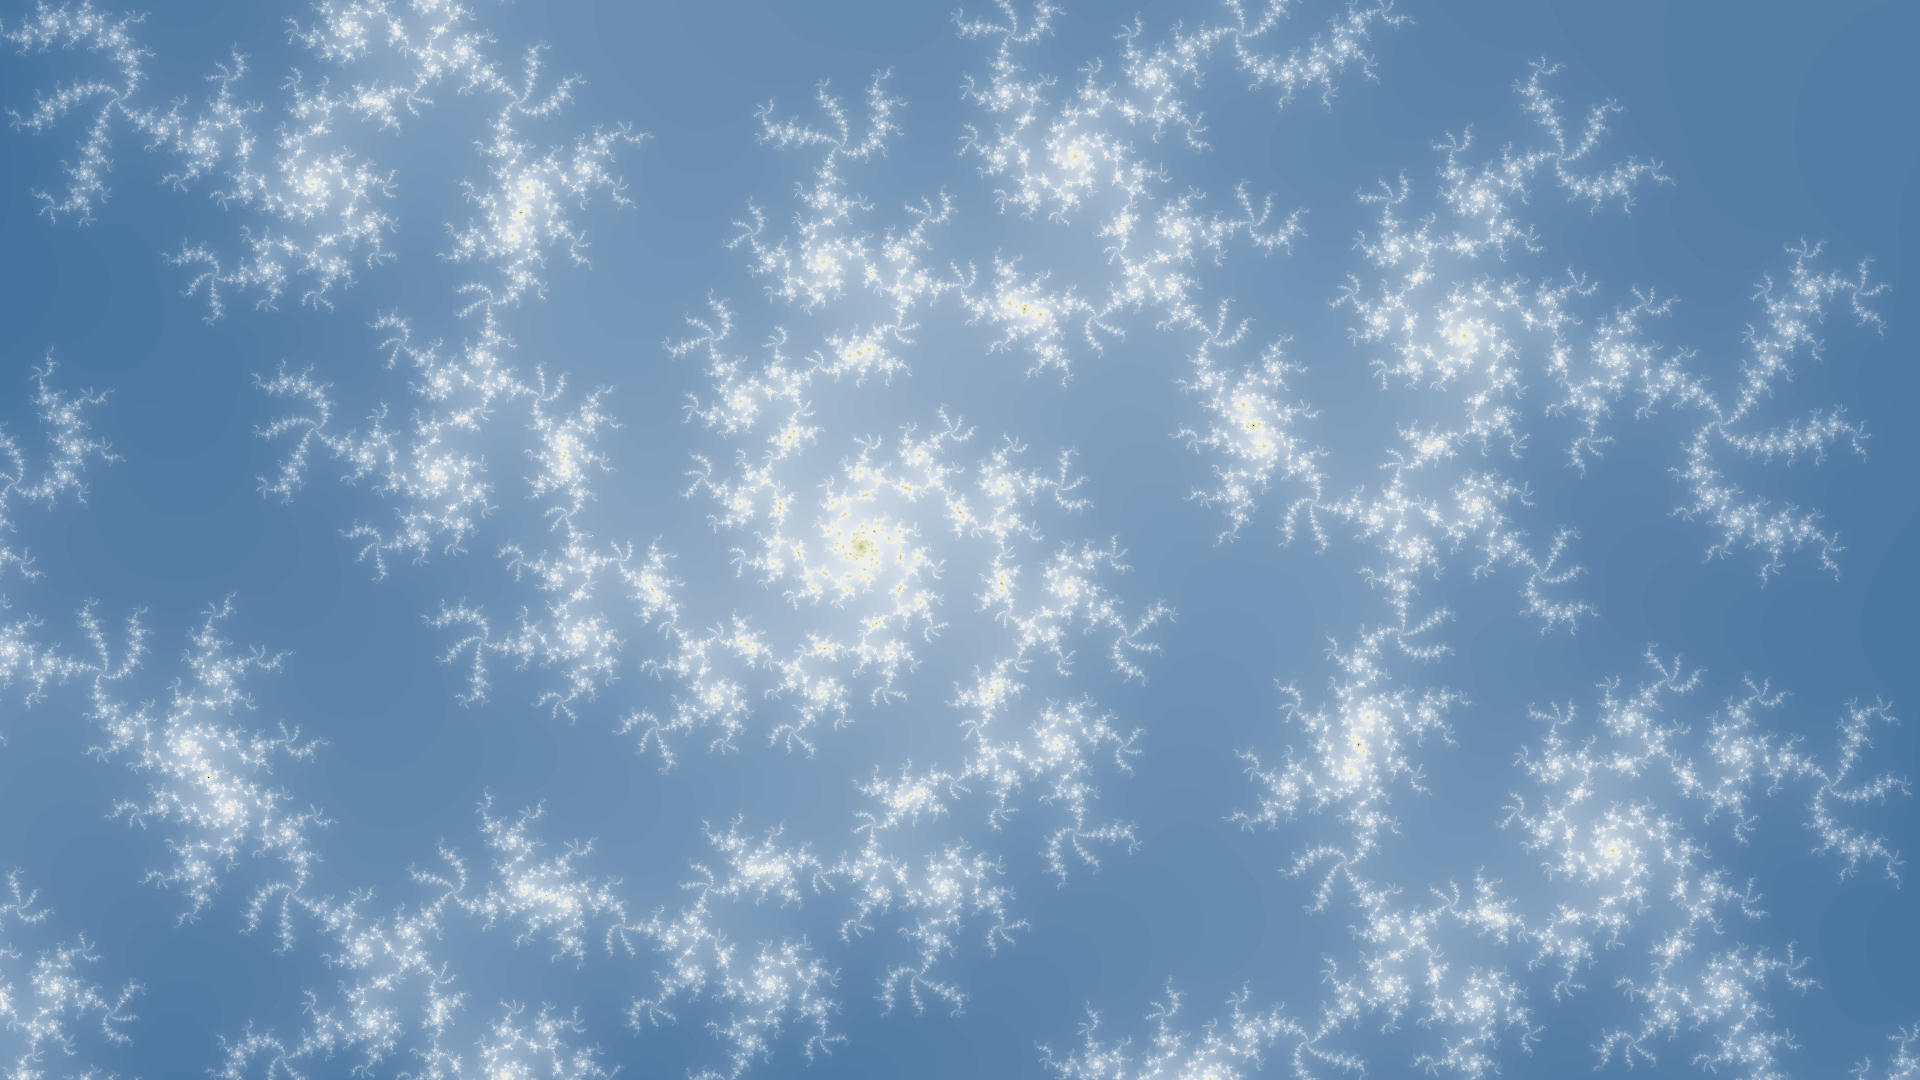
Now it gets really interesting . We can 'zoom in' on the fractal on any given point where there's 'activity' and start to see some truly incredible patterns em merge.
Calculating 'activity' and 'zoom' is outside the scope of this blog post, but still worth looking into.
All of my visualizations are made with my own rendering program, mbrot. Go check it out! The code is all open source so feel free to inspect the actual real rendering algorithm
Anyway, as a send off, here's some cool fractals.